Mass Shootings
Data Visualisation - Exploration
Now that you’ve demonstrated your software is setup, and you have the basics of data manipulation, the goal of this assignment is to practice transforming, visualising, and exploring data.
Mass shootings in the US
In July 2012, in the aftermath of a mass shooting in a movie theater in Aurora, Colorado, Mother Jones published a report on mass shootings in the United States since 1982. Importantly, they provided the underlying data set as an open-source database for anyone interested in studying and understanding this criminal behavior.
Obtain the data
## Rows: 125
## Columns: 14
## $ case                 <chr> "Oxford High School shooting", "San Jose VTA shoo…
## $ year                 <dbl> 2021, 2021, 2021, 2021, 2021, 2021, 2020, 2020, 2…
## $ month                <chr> "Nov", "May", "Apr", "Mar", "Mar", "Mar", "Mar", …
## $ day                  <dbl> 30, 26, 15, 31, 22, 16, 16, 26, 10, 6, 31, 4, 3, …
## $ location             <chr> "Oxford, Michigan", "San Jose, California", "Indi…
## $ summary              <chr> "Ethan Crumbley, a 15-year-old student at Oxford …
## $ fatalities           <dbl> 4, 9, 8, 4, 10, 8, 4, 5, 4, 3, 7, 9, 22, 3, 12, 5…
## $ injured              <dbl> 7, 0, 7, 1, 0, 1, 0, 0, 3, 8, 25, 27, 26, 12, 4, …
## $ total_victims        <dbl> 11, 9, 15, 5, 10, 9, 4, 5, 7, 11, 32, 36, 48, 15,…
## $ location_type        <chr> "School", "Workplace", "Workplace", "Workplace", …
## $ male                 <lgl> TRUE, TRUE, TRUE, TRUE, TRUE, TRUE, TRUE, TRUE, T…
## $ age_of_shooter       <dbl> 15, 57, 19, NA, 21, 21, 31, 51, NA, NA, 36, 24, 2…
## $ race                 <chr> NA, NA, "White", NA, NA, "White", NA, "Black", "B…
## $ prior_mental_illness <chr> NA, "Yes", "Yes", NA, "Yes", NA, NA, NA, NA, NA, …
| column(variable) | description |
|---|---|
| case | short name of incident |
| year, month, day | year, month, day in which the shooting occurred |
| location | city and state where the shooting occcurred |
| summary | brief description of the incident |
| fatalities | Number of fatalities in the incident, excluding the shooter |
| injured | Number of injured, non-fatal victims in the incident, excluding the shooter |
| total_victims | number of total victims in the incident, excluding the shooter |
| location_type | generic location in which the shooting took place |
| male | logical value, indicating whether the shooter was male |
| age_of_shooter | age of the shooter when the incident occured |
| race | race of the shooter |
| prior_mental_illness | did the shooter show evidence of mental illness prior to the incident? |
Explore the data
Specific questions
- Generate a data frame that summarizes the number of mass shootings per year.
mass_shootings %>%
  group_by(year) %>%
  summarise(count=n())
## # A tibble: 37 × 2
##     year count
##    <dbl> <int>
##  1  1982     1
##  2  1984     2
##  3  1986     1
##  4  1987     1
##  5  1988     1
##  6  1989     2
##  7  1990     1
##  8  1991     3
##  9  1992     2
## 10  1993     4
## # ℹ 27 more rows
- Generate a bar chart that identifies the number of mass shooters associated with each race category. The bars should be sorted from highest to lowest and each bar should show its number.
mass_shootings %>%
  group_by(race) %>%
  summarise(count=n()) %>%
  arrange(desc(count)) %>%
  ggplot(aes(x=fct_reorder(race,-count), y=count)) +
  geom_col() +
  geom_text(aes(label = count),
             hjust = 1,
             vjust = 1,
             colour = "white",
             size = 4) +
  theme_minimal() +
  labs(x = "Race", y = "Number of Shooters") +
  ggtitle("Number of Mass Shooters by Race")

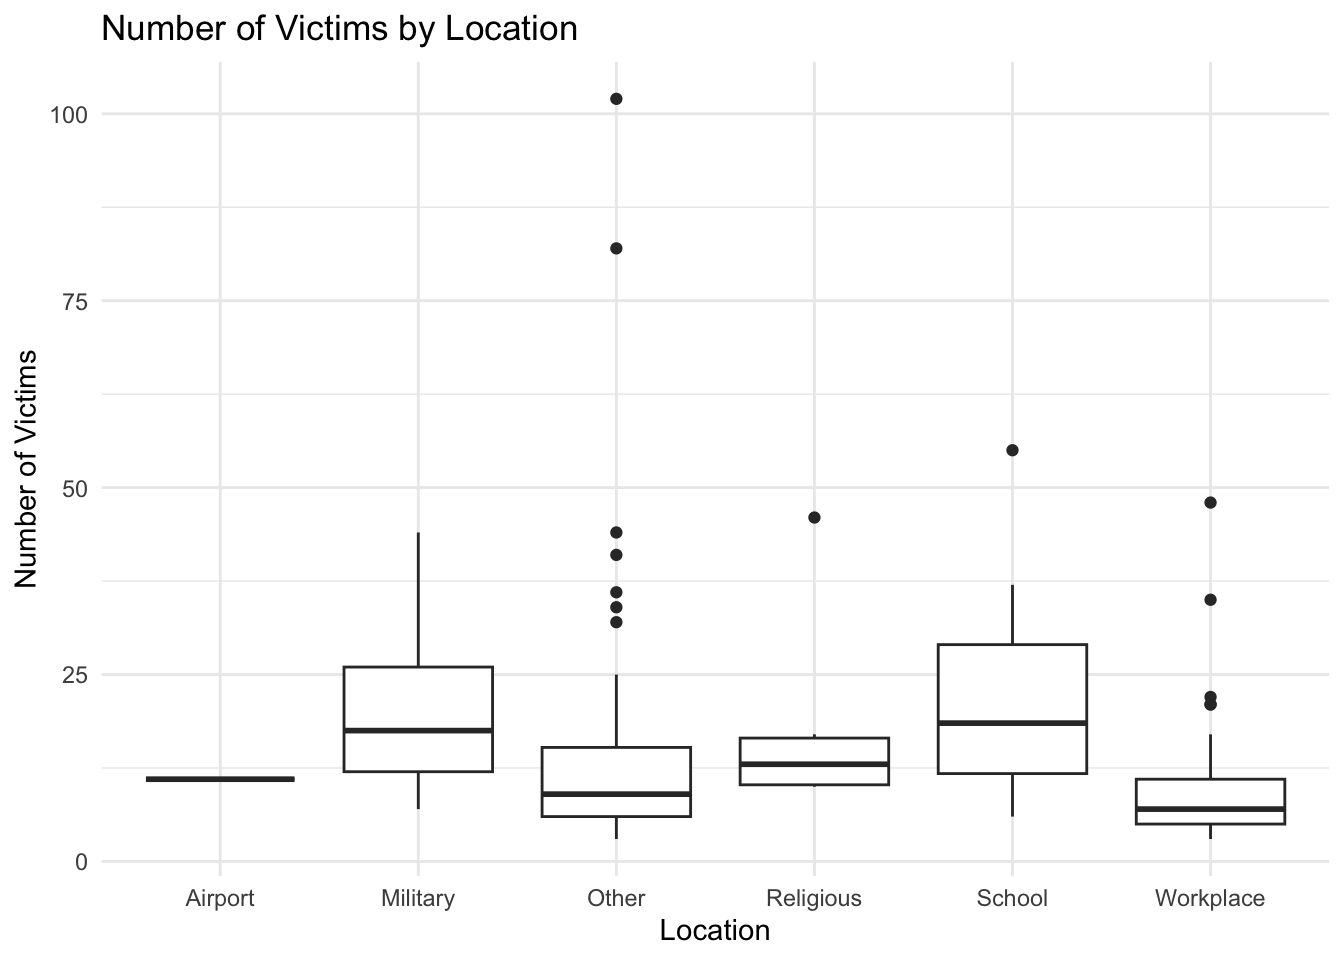
- Generate a boxplot visualizing the number of total victims, by type of location.
mass_shootings %>%
  ggplot(aes(x=location_type, y=total_victims))+
  geom_boxplot() +
  labs(x = "Location", y = "Number of Victims") +
  ggtitle("Number of Victims by Location") +
  theme_minimal()

- Redraw the same plot, but remove the Las Vegas Strip massacre from the dataset.
mass_shootings %>%
  filter(case != "Las Vegas Strip massacre") %>%
  ggplot(aes(x=location_type, y=total_victims))+
  geom_boxplot() +
  labs(x = "Location", y = "Number of Victims") +
  ggtitle("Number of Victims by Location") +
  theme_minimal()
More open-ended questions
Address the following questions. Generate appropriate figures/tables to support your conclusions.
- How many white males with prior signs of mental illness initiated a mass shooting after 2000?
mass_shootings %>%
  filter(race=="White",prior_mental_illness=="Yes", year>2000) %>%
  summarise(count=n())
## # A tibble: 1 × 1
##   count
##   <int>
## 1    23
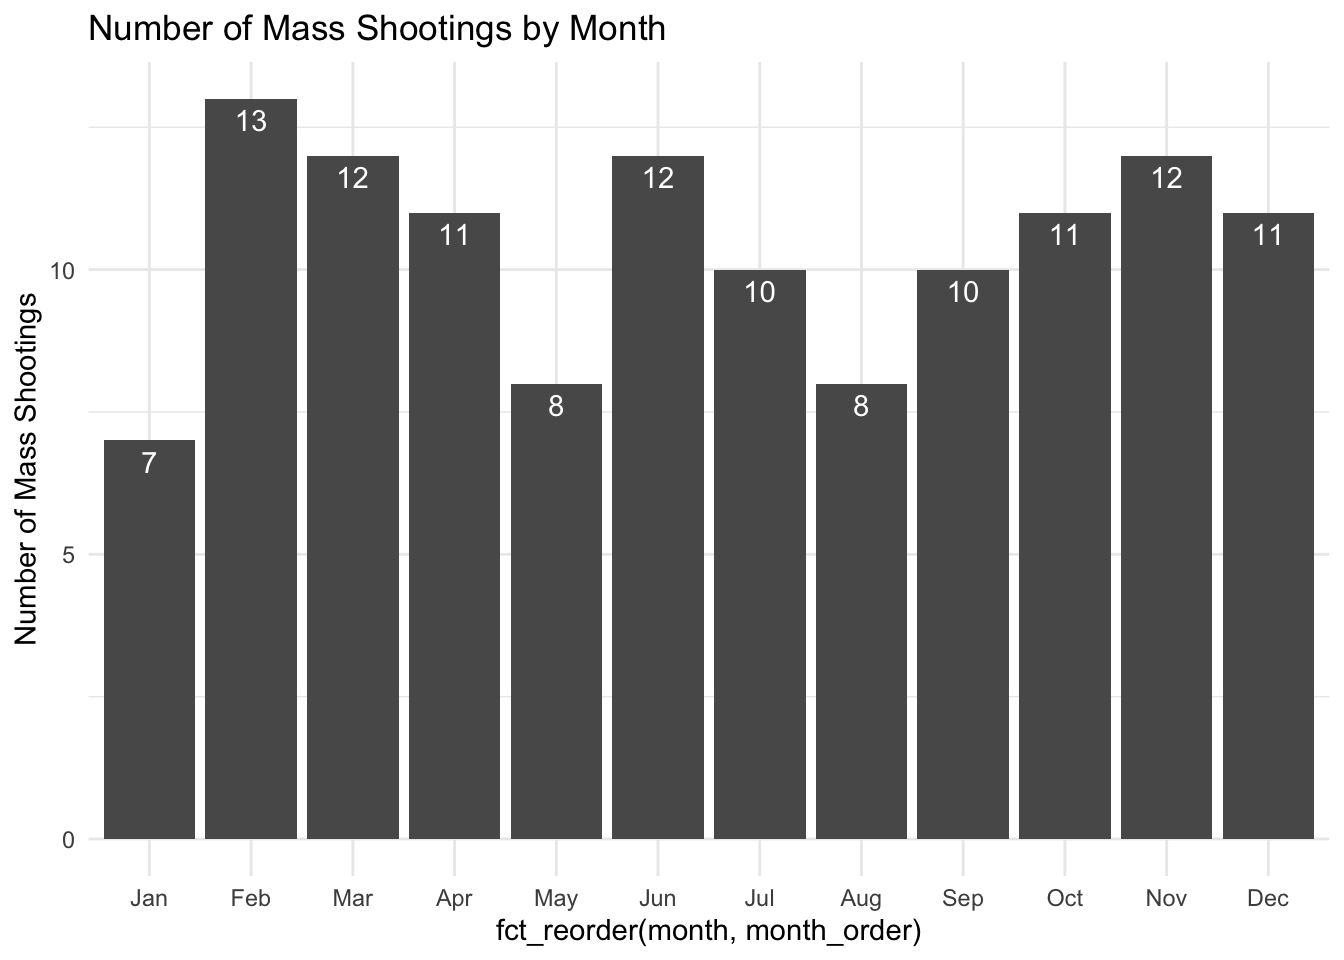
- Which month of the year has the most mass shootings? Generate a bar chart sorted in chronological (natural) order (Jan-Feb-Mar- etc) to provide evidence of your answer.
mass_shootings %>%
  group_by(month) %>%
  summarise(count=n()) %>%
  mutate(month_order = case_when(
    month=="Jan" ~ 1,
    month=="Feb" ~ 2,
    month=="Mar" ~ 3,
    month=="Apr" ~ 4,
    month=="May" ~ 5,
    month=="Jun" ~ 6,
    month=="Jul" ~ 7,
    month=="Aug" ~ 8,
    month=="Sep" ~ 9,
    month=="Oct" ~ 10,
    month=="Nov" ~ 11,
    month=="Dec" ~ 12
  )) %>%
  ggplot(aes(x=fct_reorder(month, month_order), y=count)) +
  geom_col() +
  labs(y = "Number of Mass Shootings") +
  ggtitle("Number of Mass Shootings by Month") +
  theme_minimal() +
  geom_text(aes(label=count), color='white', vjust=1.5)
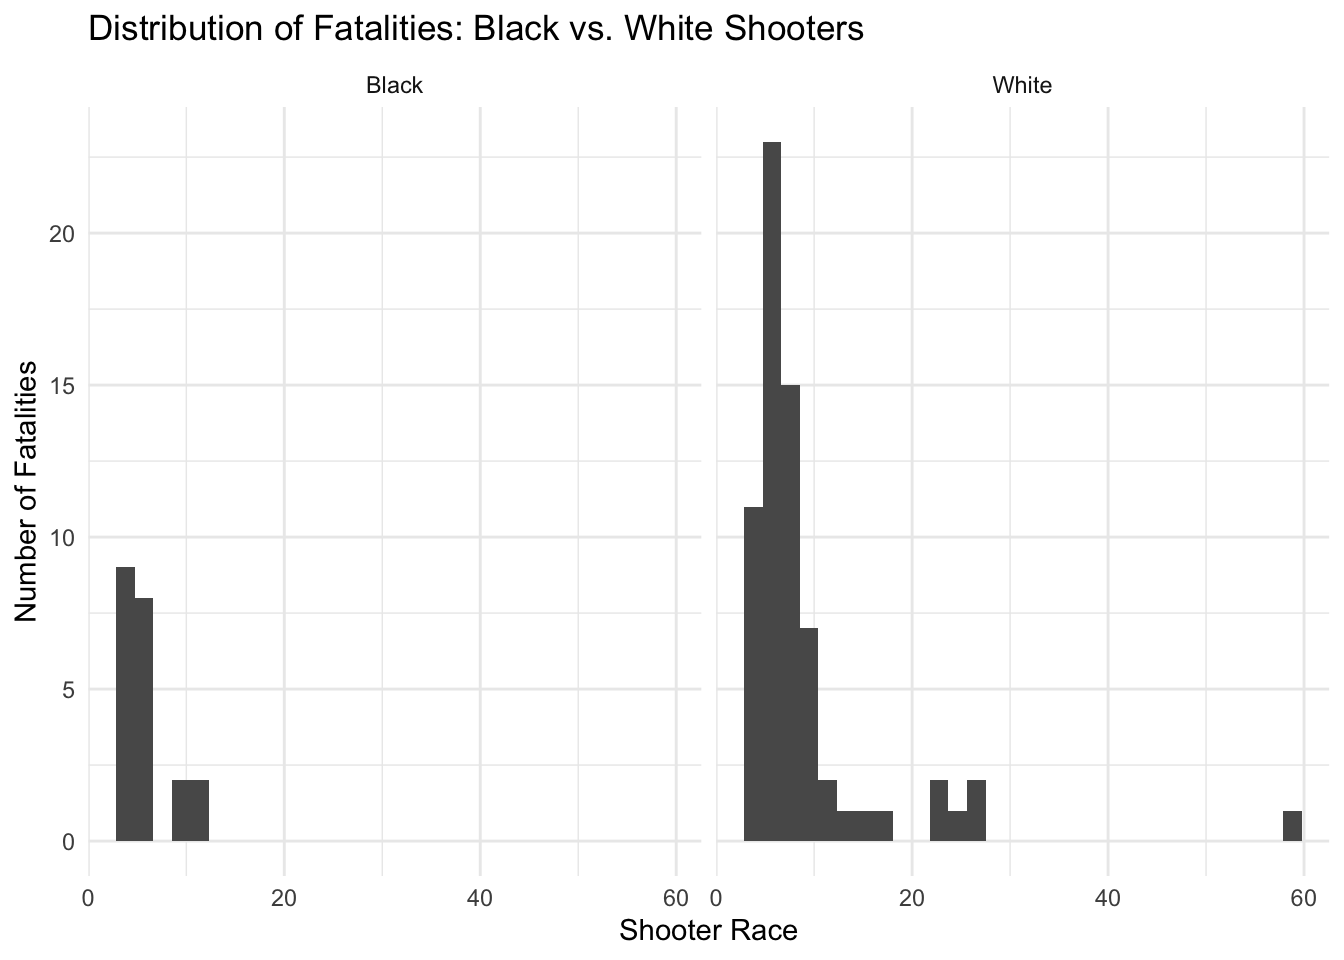
- How does the distribution of mass shooting fatalities differ between White and Black shooters? What about White and Latino shooters?
mass_shootings %>%
  filter(race=="White" | race=="Black") %>%
  ggplot(aes(x=fatalities)) +
  geom_histogram() +
  facet_wrap(vars(race)) +
  labs(x = "Shooter Race", y = "Number of Fatalities") +
  ggtitle("Distribution of Fatalities: Black vs. White Shooters") +
  theme_minimal()
## `stat_bin()` using `bins = 30`. Pick better value with `binwidth`.
Very open-ended
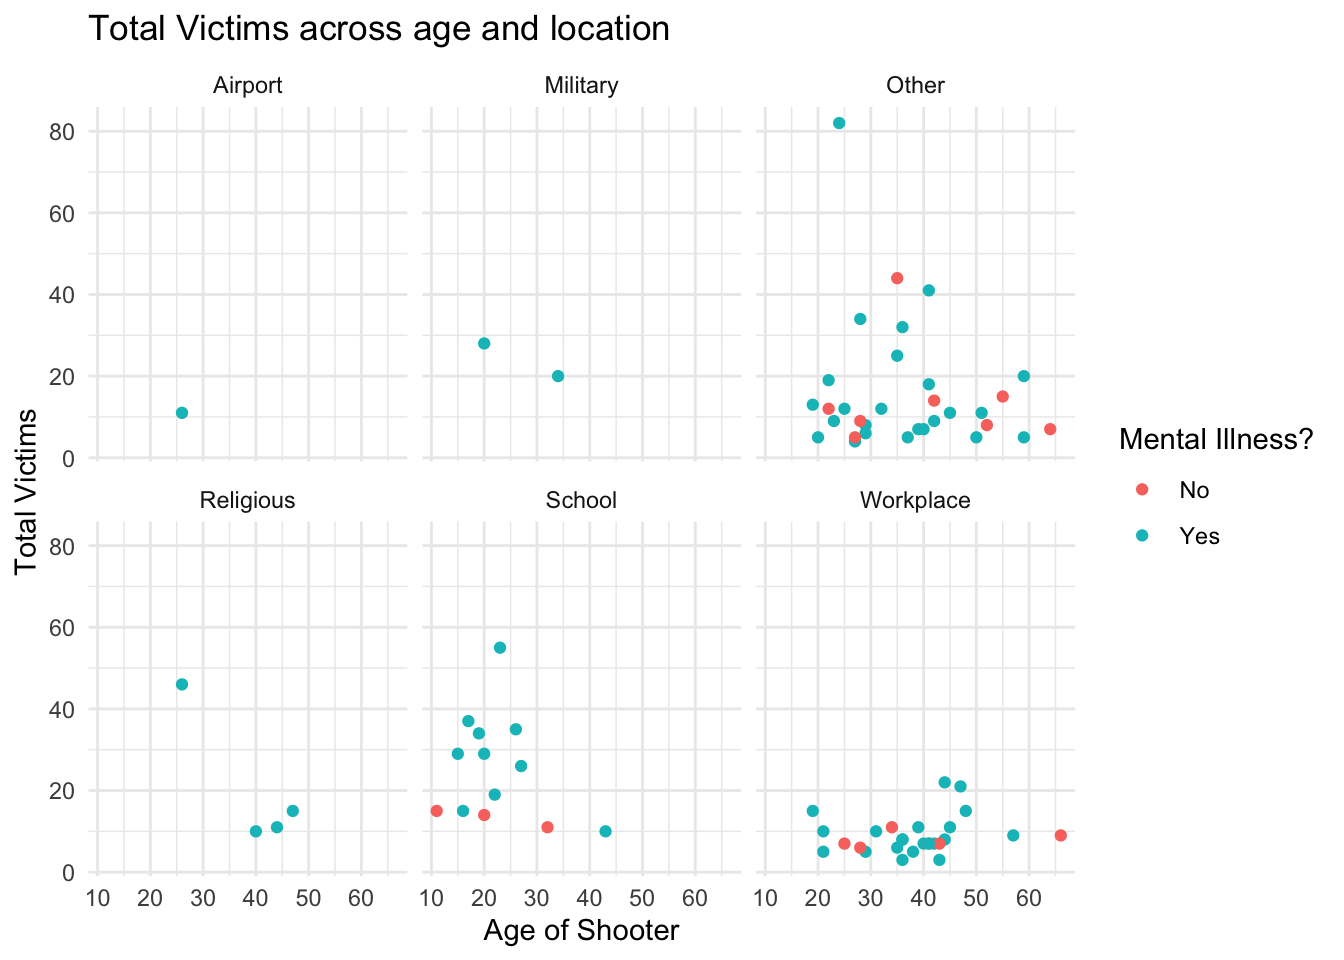
- Are mass shootings with shooters suffering from mental illness different from mass shootings with no signs of mental illness in the shooter?
mass_shootings %>%
  filter(!is.na(prior_mental_illness)) %>%
  ggplot()+
  geom_point(aes(x=age_of_shooter, y=total_victims, color=prior_mental_illness)) +
  facet_wrap(vars(location_type)) +
  theme_minimal() +
  labs(x = "Age of Shooter", y = "Total Victims") +
  ggtitle("Total Victims across age and location") +
  guides(color=guide_legend(title="Mental Illness?"))
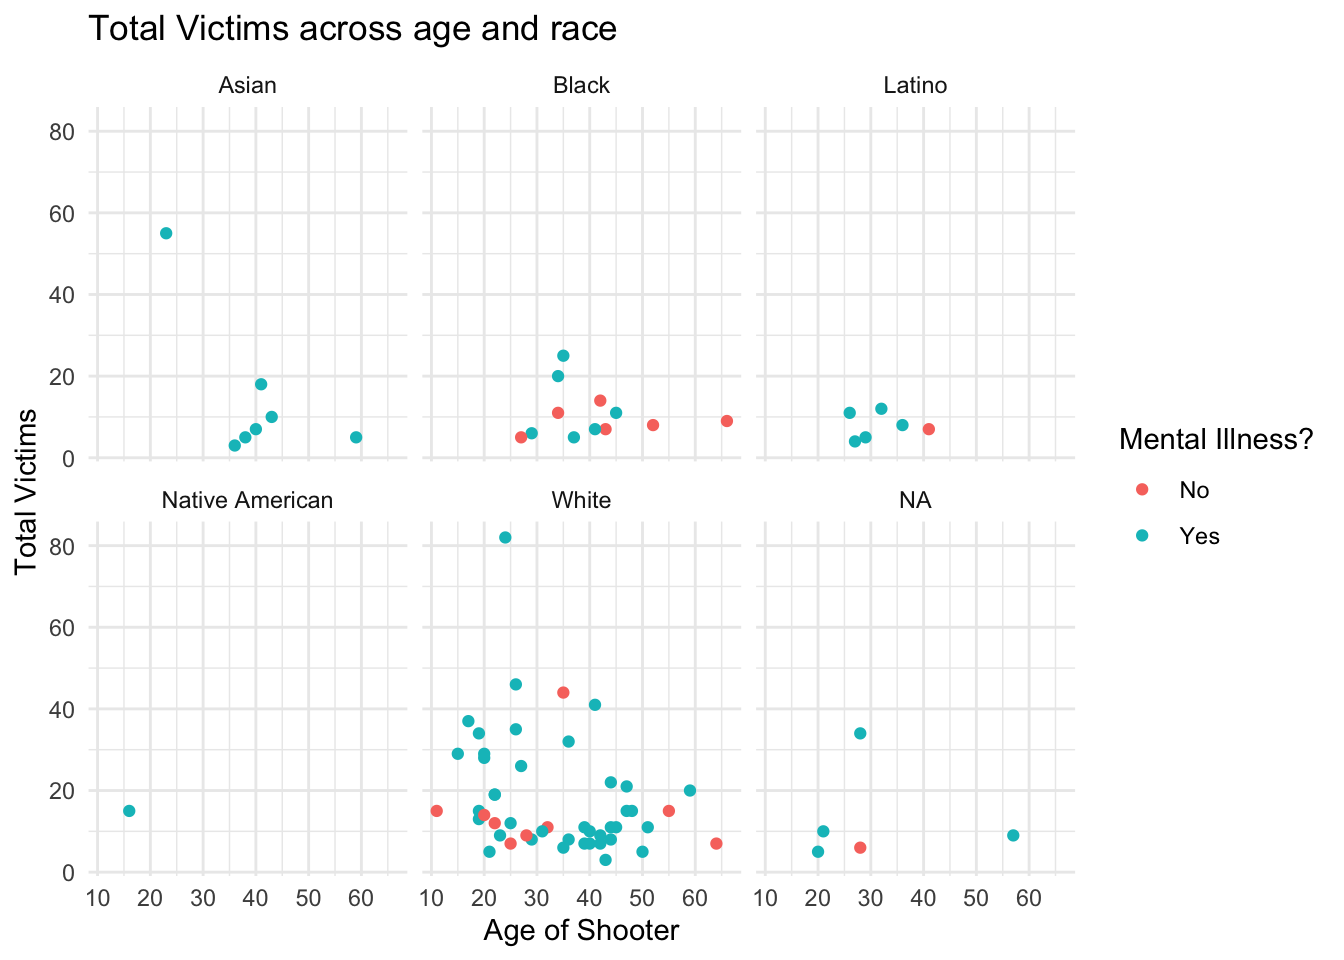
mass_shootings %>%
  filter(!is.na(prior_mental_illness)) %>%
  ggplot()+
  geom_point(aes(x=age_of_shooter, y=total_victims, color=prior_mental_illness)) +
  facet_wrap(vars(race)) +
  theme_minimal() +
  labs(x = "Age of Shooter", y = "Total Victims") +
  ggtitle("Total Victims across age and race") +
  guides(color=guide_legend(title="Mental Illness?"))
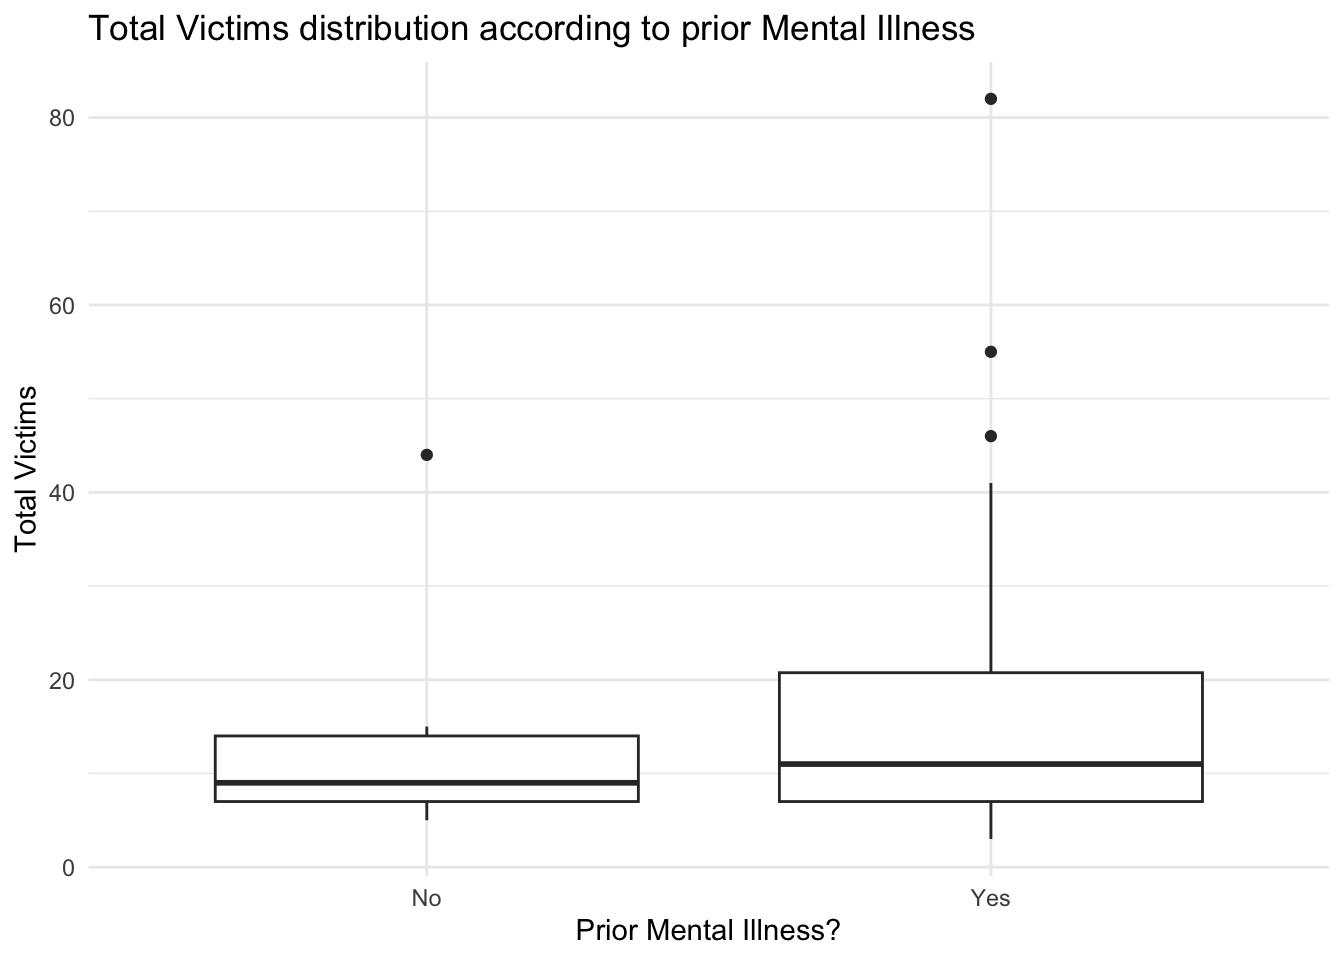
- Assess the relationship between mental illness and total victims, mental illness and location type, and the intersection of all three variables.
mass_shootings %>%
  filter(!is.na(prior_mental_illness)) %>%
  ggplot(aes(x=prior_mental_illness,y=total_victims)) +
  geom_boxplot() +
  theme_minimal() +
  labs(x = "Prior Mental Illness?", y = "Total Victims") +
  ggtitle("Total Victims distribution according to prior Mental Illness")
mass_shootings %>%
  filter(!is.na(prior_mental_illness)) %>%
  group_by(prior_mental_illness, location_type) %>%
  summarise(count=n()) %>%
  ggplot() +
  geom_col(aes(x=location_type, y=count, fill=prior_mental_illness)) +
  theme_minimal() +
  labs(x = "Location", y = "Total Victims") +
  ggtitle("Number of Shootings Incidences by locations") +
  guides(fill=guide_legend(title="Mental Illness?"))
## `summarise()` has grouped output by 'prior_mental_illness'. You can override
## using the `.groups` argument.

Make sure to provide a couple of sentences of written interpretation of your tables/figures. Graphs and tables alone will not be sufficient to answer this question.